
Reading Your Own QEEG Brain Map

Intro to Functional EEG and QEEG
Quantitative Electroencephalography (QEEG) is a powerful tool for understanding brain function and has applications in both clinical and performance optimization contexts. In this article, we’ll dive into the basics of QEEG brain mapping, how to interpret the data, and why it’s valuable for understanding your own brain function.
QEEG is a quantitative analysis of EEG (Electroencephalography) or “brain wave” data, gathered from scalp sensors. While EEG has been used for decades to study brain activity, QEEG takes this a step further by applying advanced statistical methods to compare an individual’s brain activity to a normative database. This allows us to identify patterns in electrical activity that may be atypical or indicative of how certain resources might be operating within each person – especially features of attention, fatigue, sleep, and stress.
This is Part 1 of 2. In Part 2 we will dig deeper into exploratory data visualization using free tools for LORETA source analysis.
Who am I?
If we haven’t met yet, I’m Andrew Hill, PhD, a Cognitive Neuroscience and Biohacking Coach, and the founder of Peak Brain Institute. With over 25 years of experience in neurofeedback, I’ve worked in research as well as various clinical environments, helping people from children to older adults optimize their brain function. My goal is to make the complex world of neuroscience accessible and practical for individuals looking to understand and improve their cognitive performance.
1. What is QEEG Brain Mapping? How is it used??
Broadly, analysis of EEG or “brain waves:, recorded from wires on the head. EEG is gathered in a noninvasive way, and is a safe and effective way to get a picture of brain activity. It can show broad features of regulation, with changes in fast or slow brainwaves in different areas of the brain associated with different states of function in those specific brain regions. attention, stress, sleep, speed of processing within cortical ares
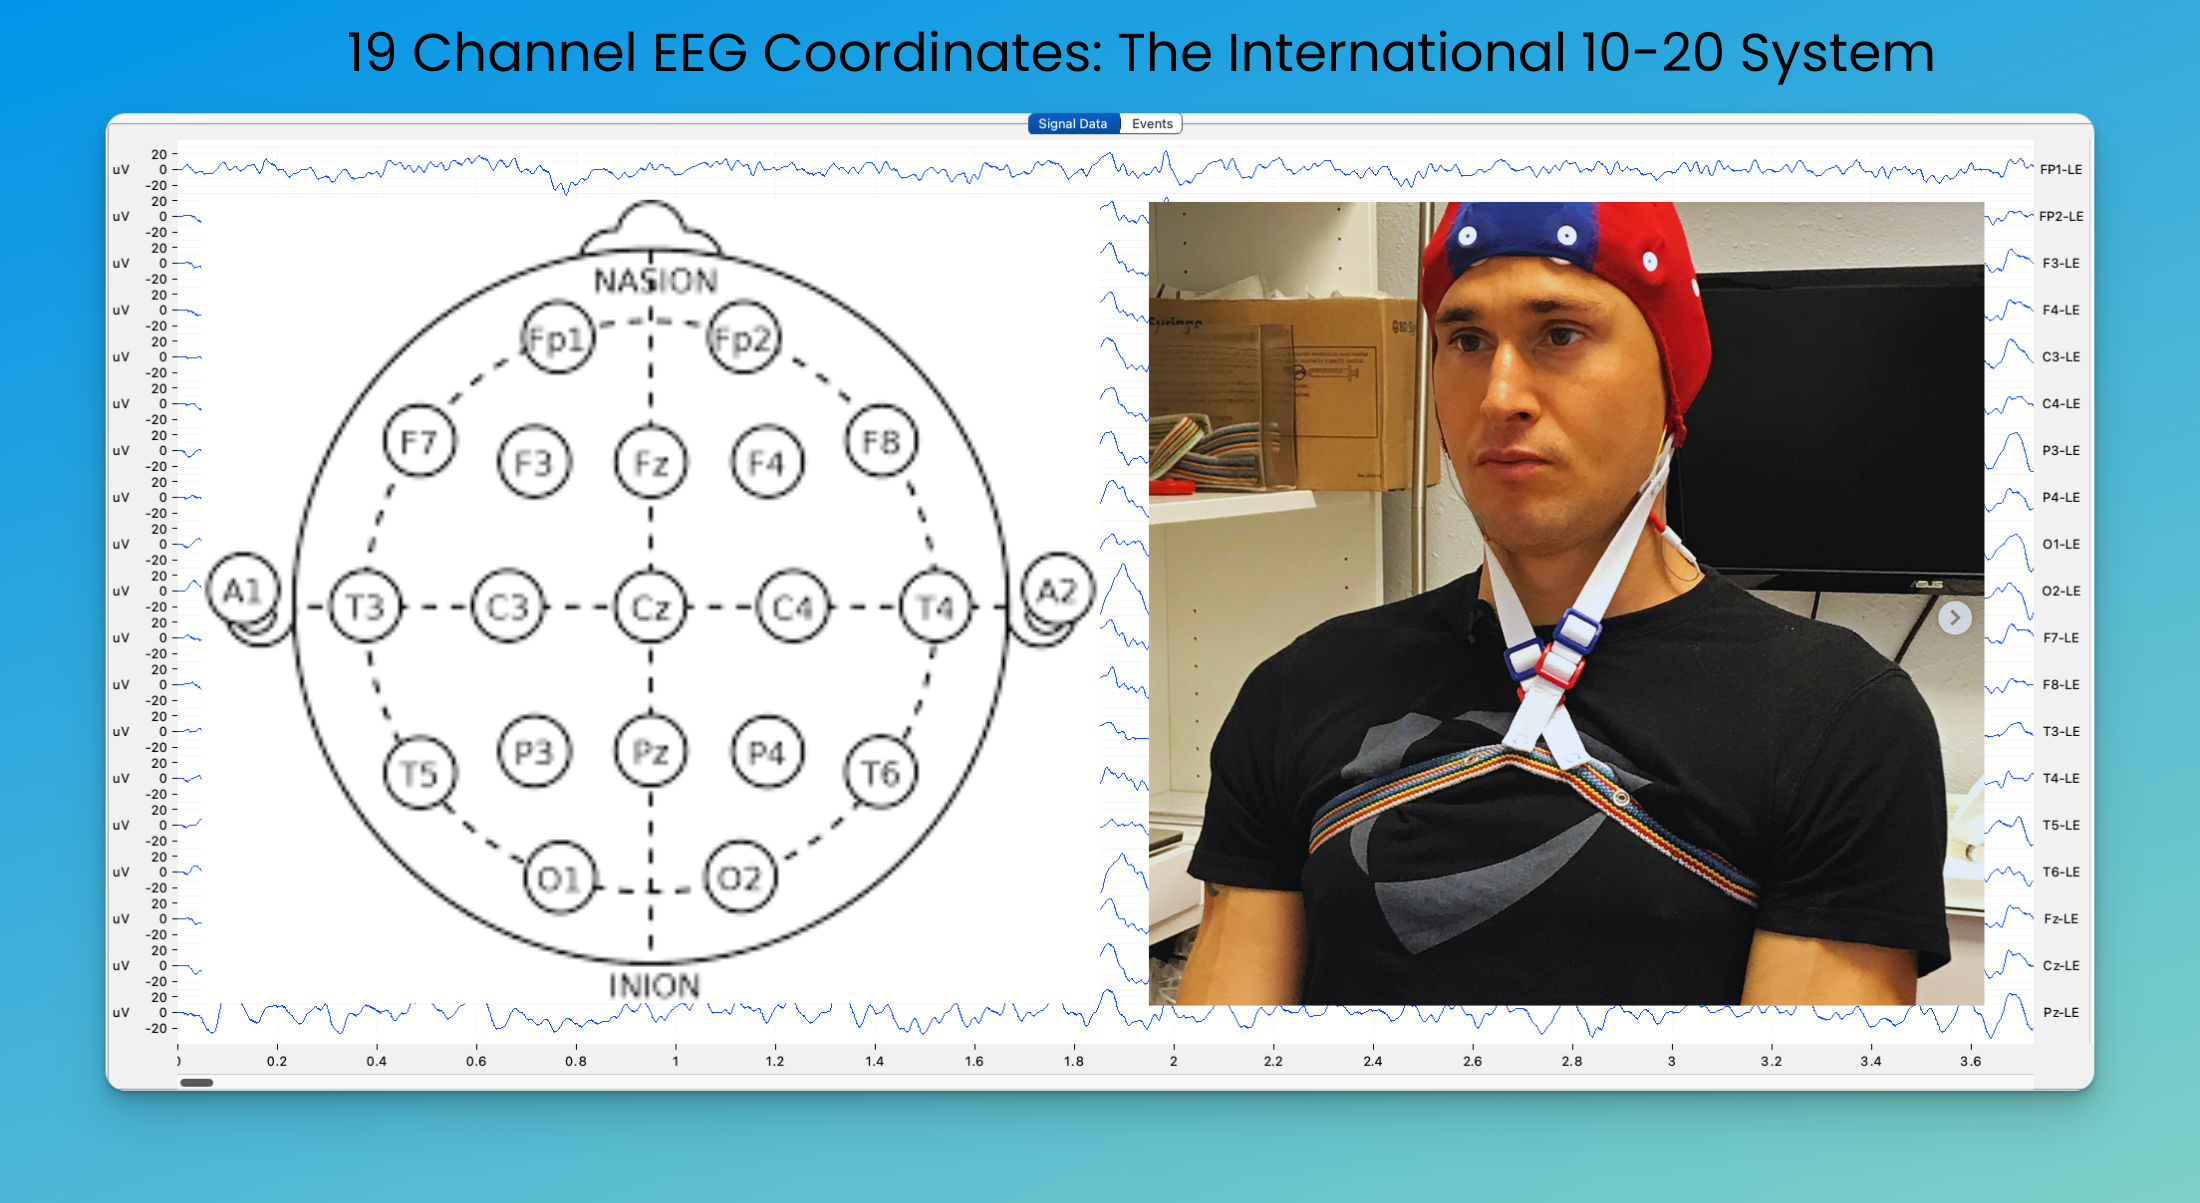
- Data Collection: EEG data is collected using electrodes placed on the scalp. Typically, a standard 19-channel setup is used, following the International 10-20 system.
- Data Cleaning: The raw EEG data is cleaned to remove artifacts such as eye blinks, muscle movements, and external electrical interference.
- Quantitative Analysis: The cleaned data is then analyzed using various mathematical techniques to extract meaningful features. These include:
- Amplitudes: The strength or voltage in different frequency bands.
- Frequencies: The type of brain waves present (e.g., delta, theta, alpha, beta, gamma).
- Connectivity: How different brain regions communicate with each other, measured through coherence and phase relationships.
- Asymmetry: Differences in activity between corresponding areas of the left and right hemispheres, or between front and back.
- Normative Comparison: One individual’s data is compared to a database of age-matched “typical” brains. This comparison yields z-scores, which indicate how many standard deviations an individual’s measurements are from the population mean.
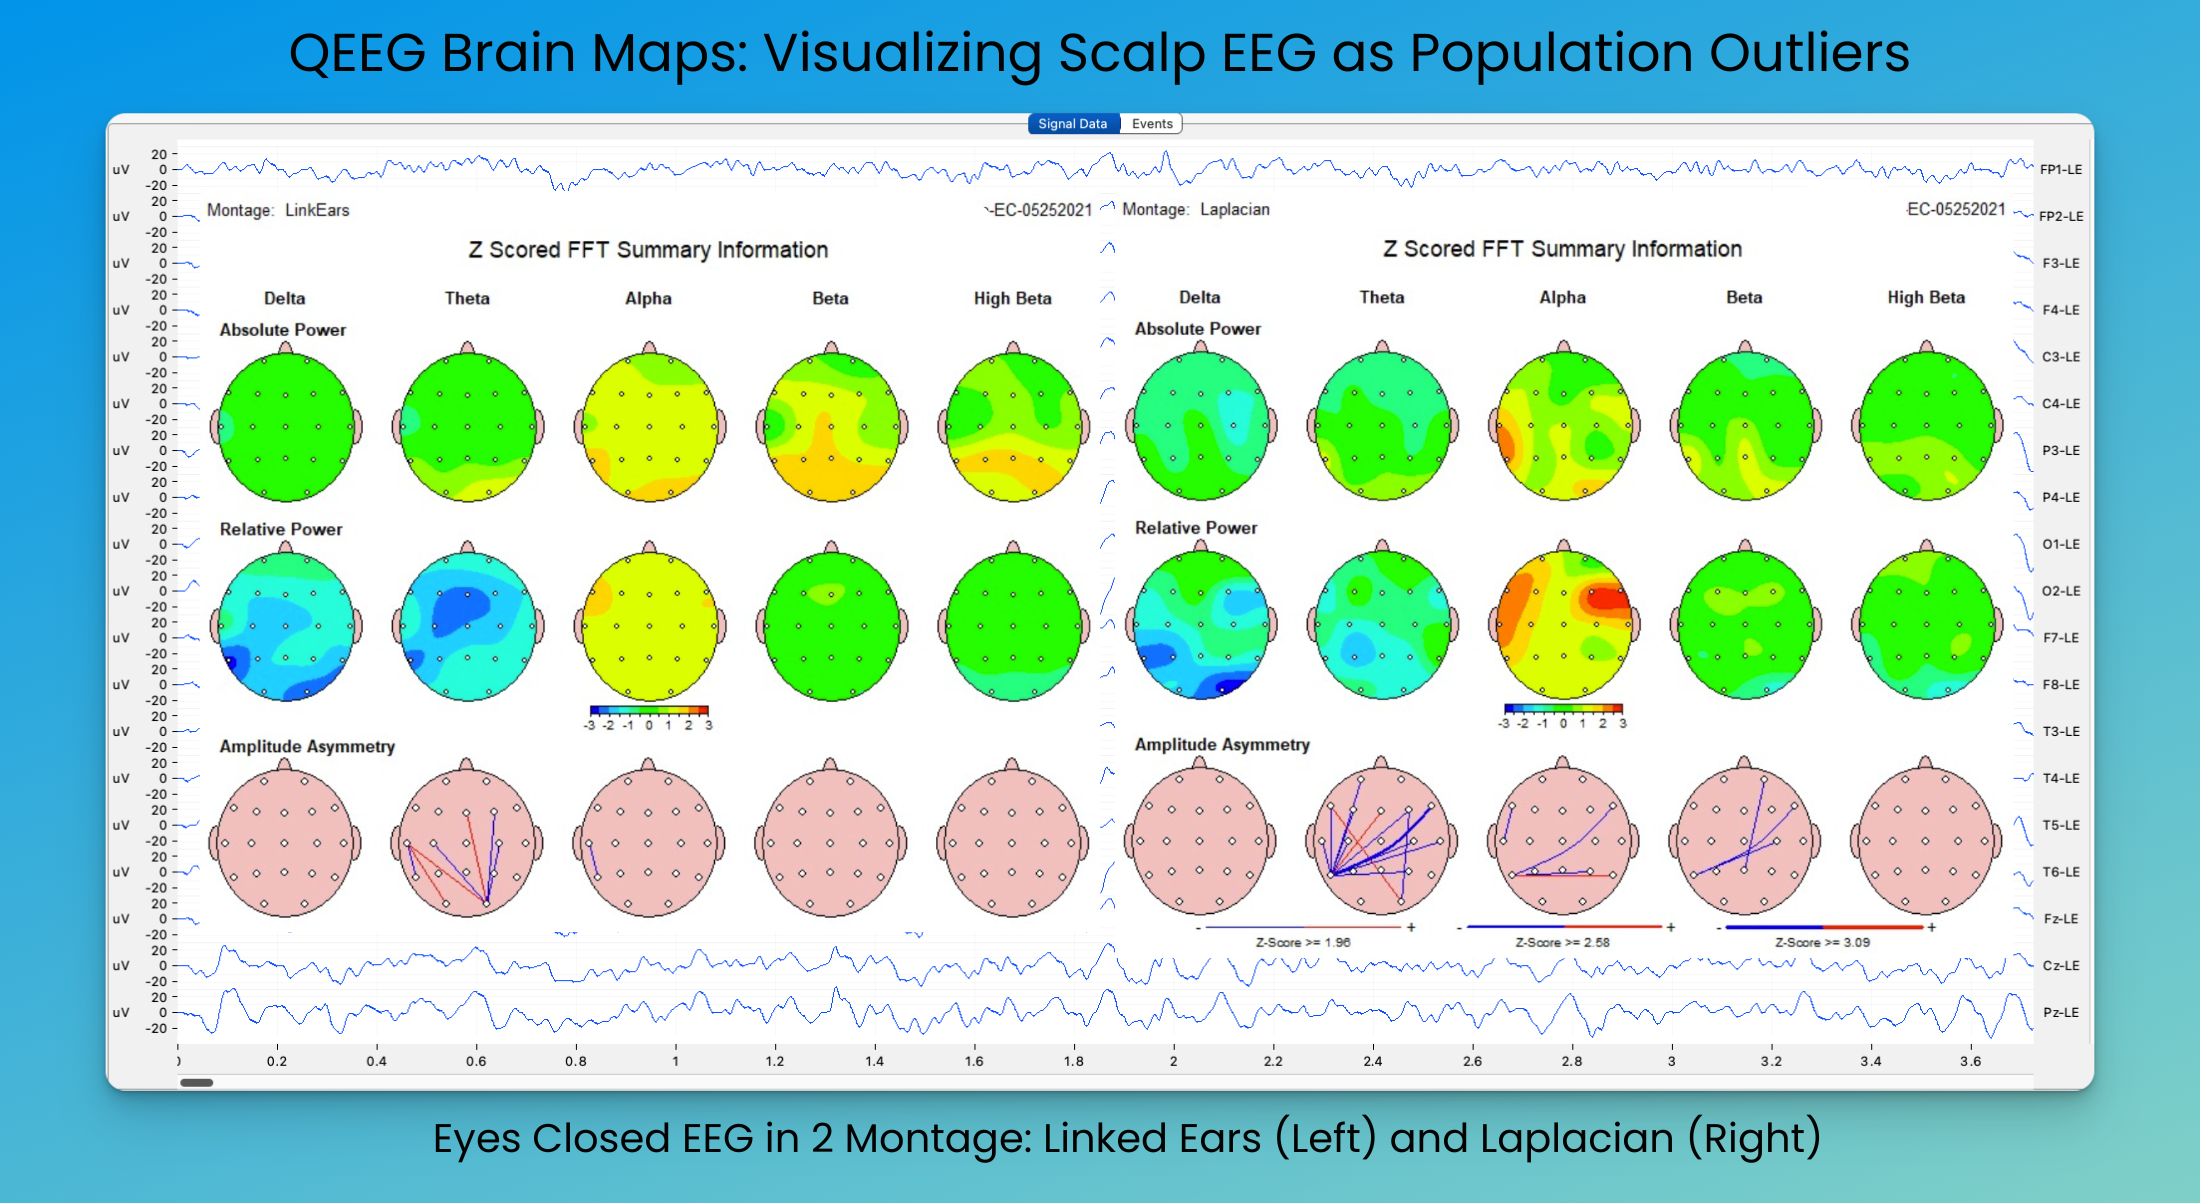
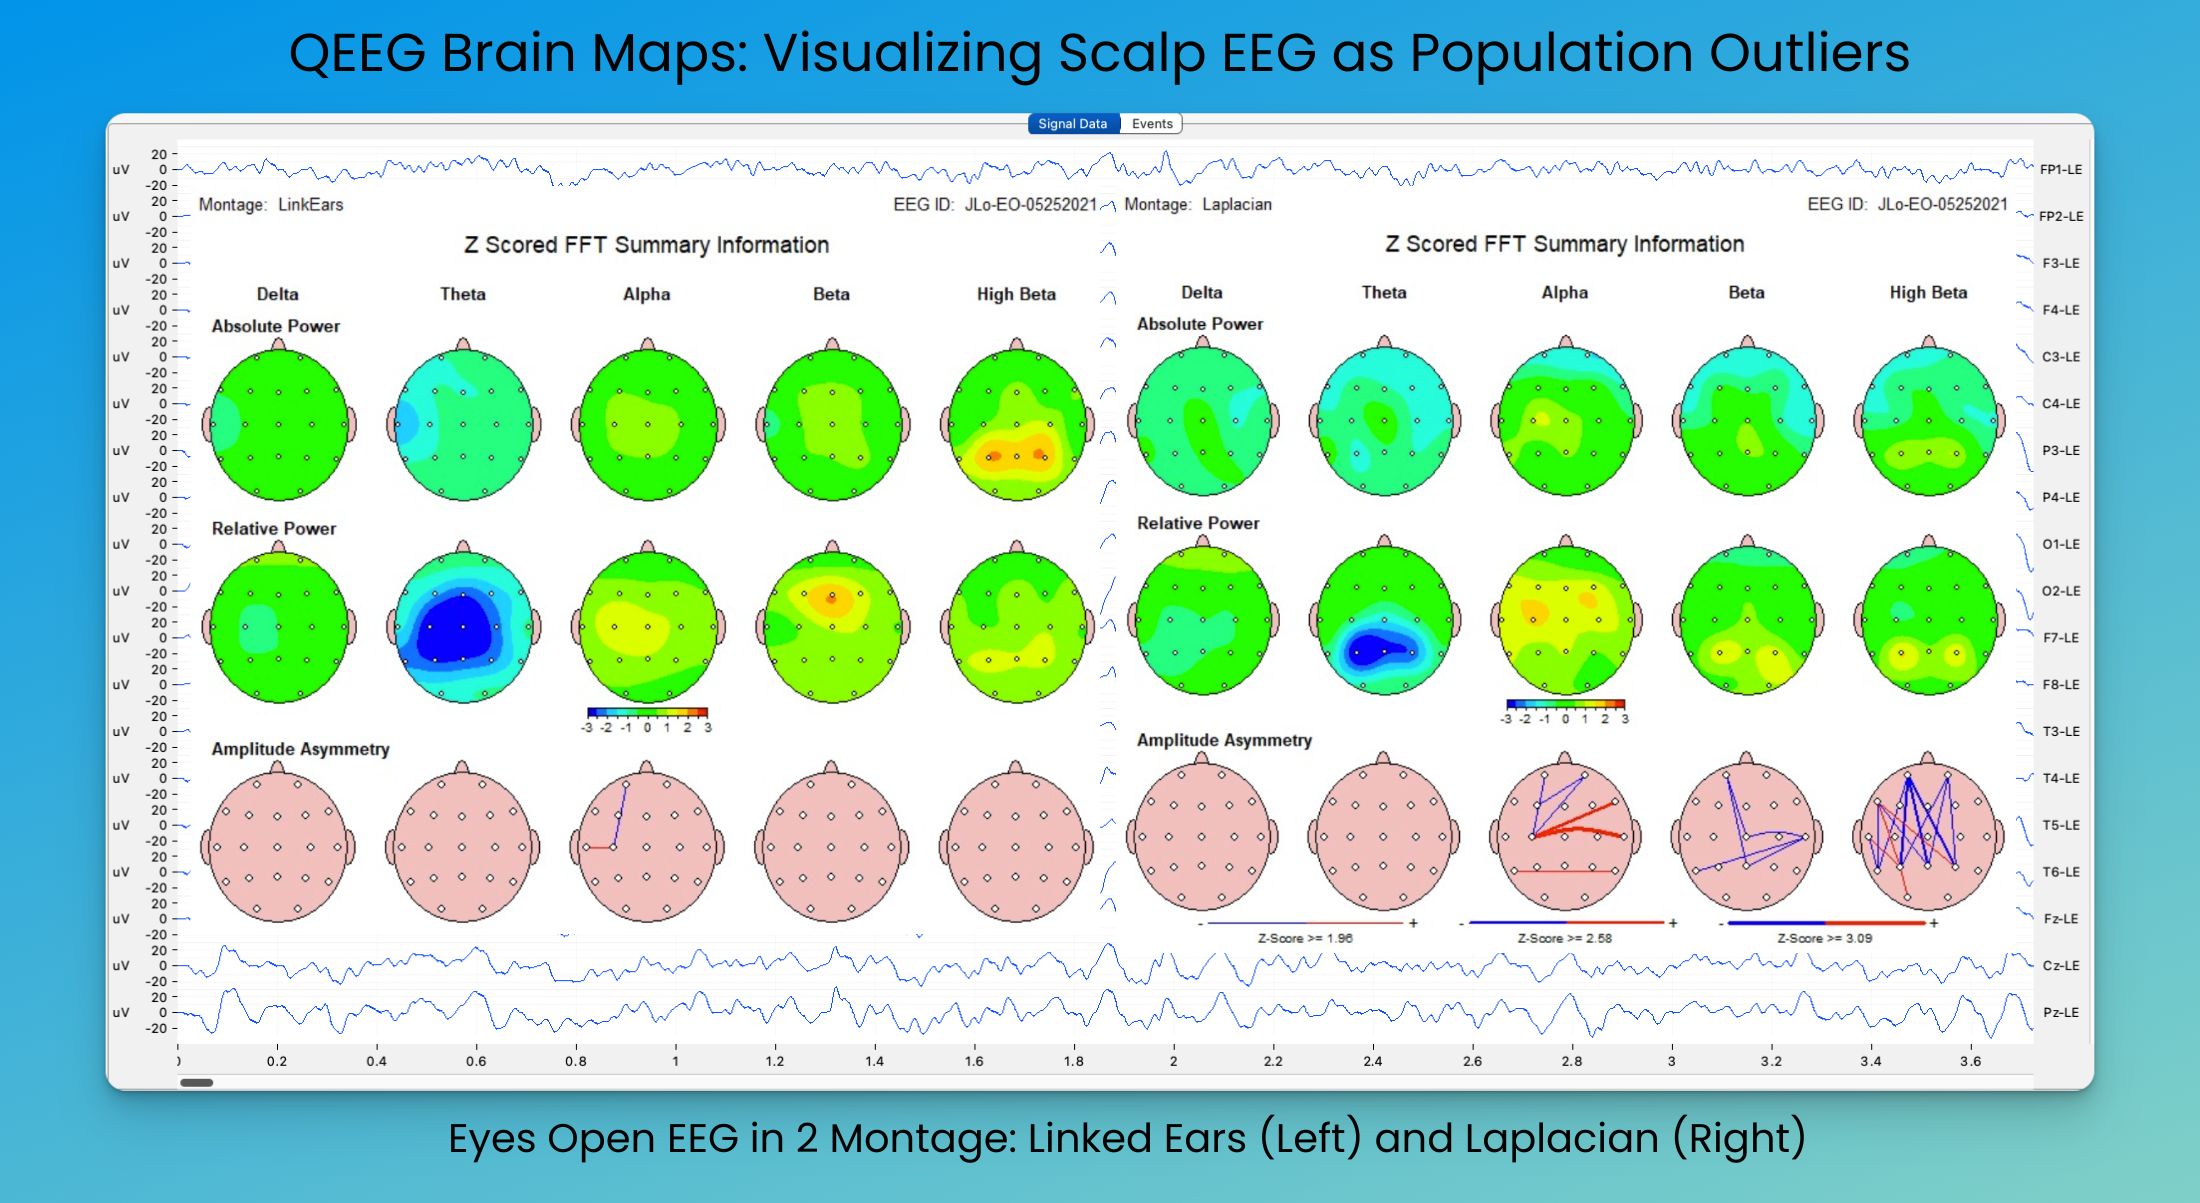
- Visualization: The results are typically presented as colorful brain maps, showing areas of increased or decreased activity compared to the norm. Typically these are looked at in Eyes Closed and Eyes Open plots, in at least 2 spatial montages.
It’s crucial to understand that being “average” or in the middle of the bell curve is not necessarily the goal. Many successful individuals have atypical brain patterns that work well for them. The aim of QEEG is to understand your unique brain function, not to conform to an arbitrary norm. So good job, be your weird and unique self. We want to think in terms of atypical versus abnormal, and learn and understand those features of your brain that we can see from the EEG.
QEEG is used in various contexts, including:
- Identifying patterns associated with cognitive or emotional challenges
- Guiding neurofeedback training protocols to optimize effects
- Monitoring changes in brain function over time
- Evaluating response to medication
- Optimizing cognitive performance in high-demand professions
Remember, QEEG is primarily an exploratory tool. It provides information about brain function but is not a standalone diagnostic tool. Its real power lies in its ability to guide further investigation and personalized interventions.
2. Best practices for gathering data?
Remember that QEEG picks up broad traits and resources, not momentary states. Still, it can be changed by environmental factors. To ensure the most accurate and useful QEEG data, consider the following best practices:
- Time of Day: Morning recordings are often preferred as they minimize the impact of daily stressors and fatigue.
- Substance Use: Avoid substances that can alter brain activity for at least 12 hours before the recording.
- Cutoff for Caffeine: 4pm the day before (including chocolate, decaf)
- Cutoff for Cannabis: 24 hours for inhaled, 48 hours for edible
- Cutoff for Psychostimulants (Adderall, Ritalin): 48 hours from last dose
- Medication: If possible, record a baseline QEEG before starting new medications. For ongoing medications, consistency is key – maintain your usual regimen unless otherwise advised by a healthcare professional, but ideally record in the morning before your daily doses. Many drugs have only subtle impact on the EEG, and we can see your large features regardless of an antidepressant, etc.
- State vs. Trait: While QEEG primarily captures trait-like characteristics of brain function, extreme states (like high stress or sleep deprivation) can influence results. Aim for a typical day when recording. Jet lag will show up, for instance, for about 1 day per hour of time zone.
- Multiple Conditions: Record data in both eyes-closed and eyes-open conditions to capture different aspects of brain function.
- Duration: Typically, 10 minutes of eyes-closed and 10 minutes of eyes-open data are recorded to ensure sufficient clean data for analysis.
- Format: 19 channels on scalp, plus both Ears (A1, A2), and files should be prepared in EDF format – tis is a standard export for most EEG systems.
- Supplementary Testing: Combine the QEEG with performance tests (like an attention test or Continuous Performance Task) to provide context for the electrophysiological data.
By following these practices, you can obtain a QEEG that provides a reliable representation of your typical brain function.
3. QEEG Process:
Recording EEG: What kind of EEG data can be used?
The EEG recording process is relatively straightforward:
- Electrodes are placed on the scalp using a cap or individually applied.
- A conductive gel is used to ensure good electrical contact.
- The participant sits comfortably, typically first with eyes closed, then with eyes open.
- Data is recorded for a specified duration (usually 10 minutes in each condition).
These are similar recordings as you might do for sleep, seizure, etc, just shorter duration, and in fact a sleep lab may be able to do an EEG for you, to submit to someone for analysis.
If you need a recording, Peak Brain Institute can do it in 6 offices plus via Remote guided QEEG within the US.
EEG is a pretty quick and painless process. The hardest part is often doing one early in the day without caffeine, or perhaps putting up with the boring attention test, or getting your hair messy.
Brainwaves: reading Raw EEG
Before diving into QEEG analysis, it’s crucial to understand the raw EEG data.
This involves recognizing common artifacts (noise) such as:
- Eye blinks and eye movements
- Muscle tension (EMG)
- Pulse movement (CBA)
- Heart beat signals (EKG)
- Movement artifacts
- Popping electrodes & weak signals
- Sweat artifacts (slow drift)
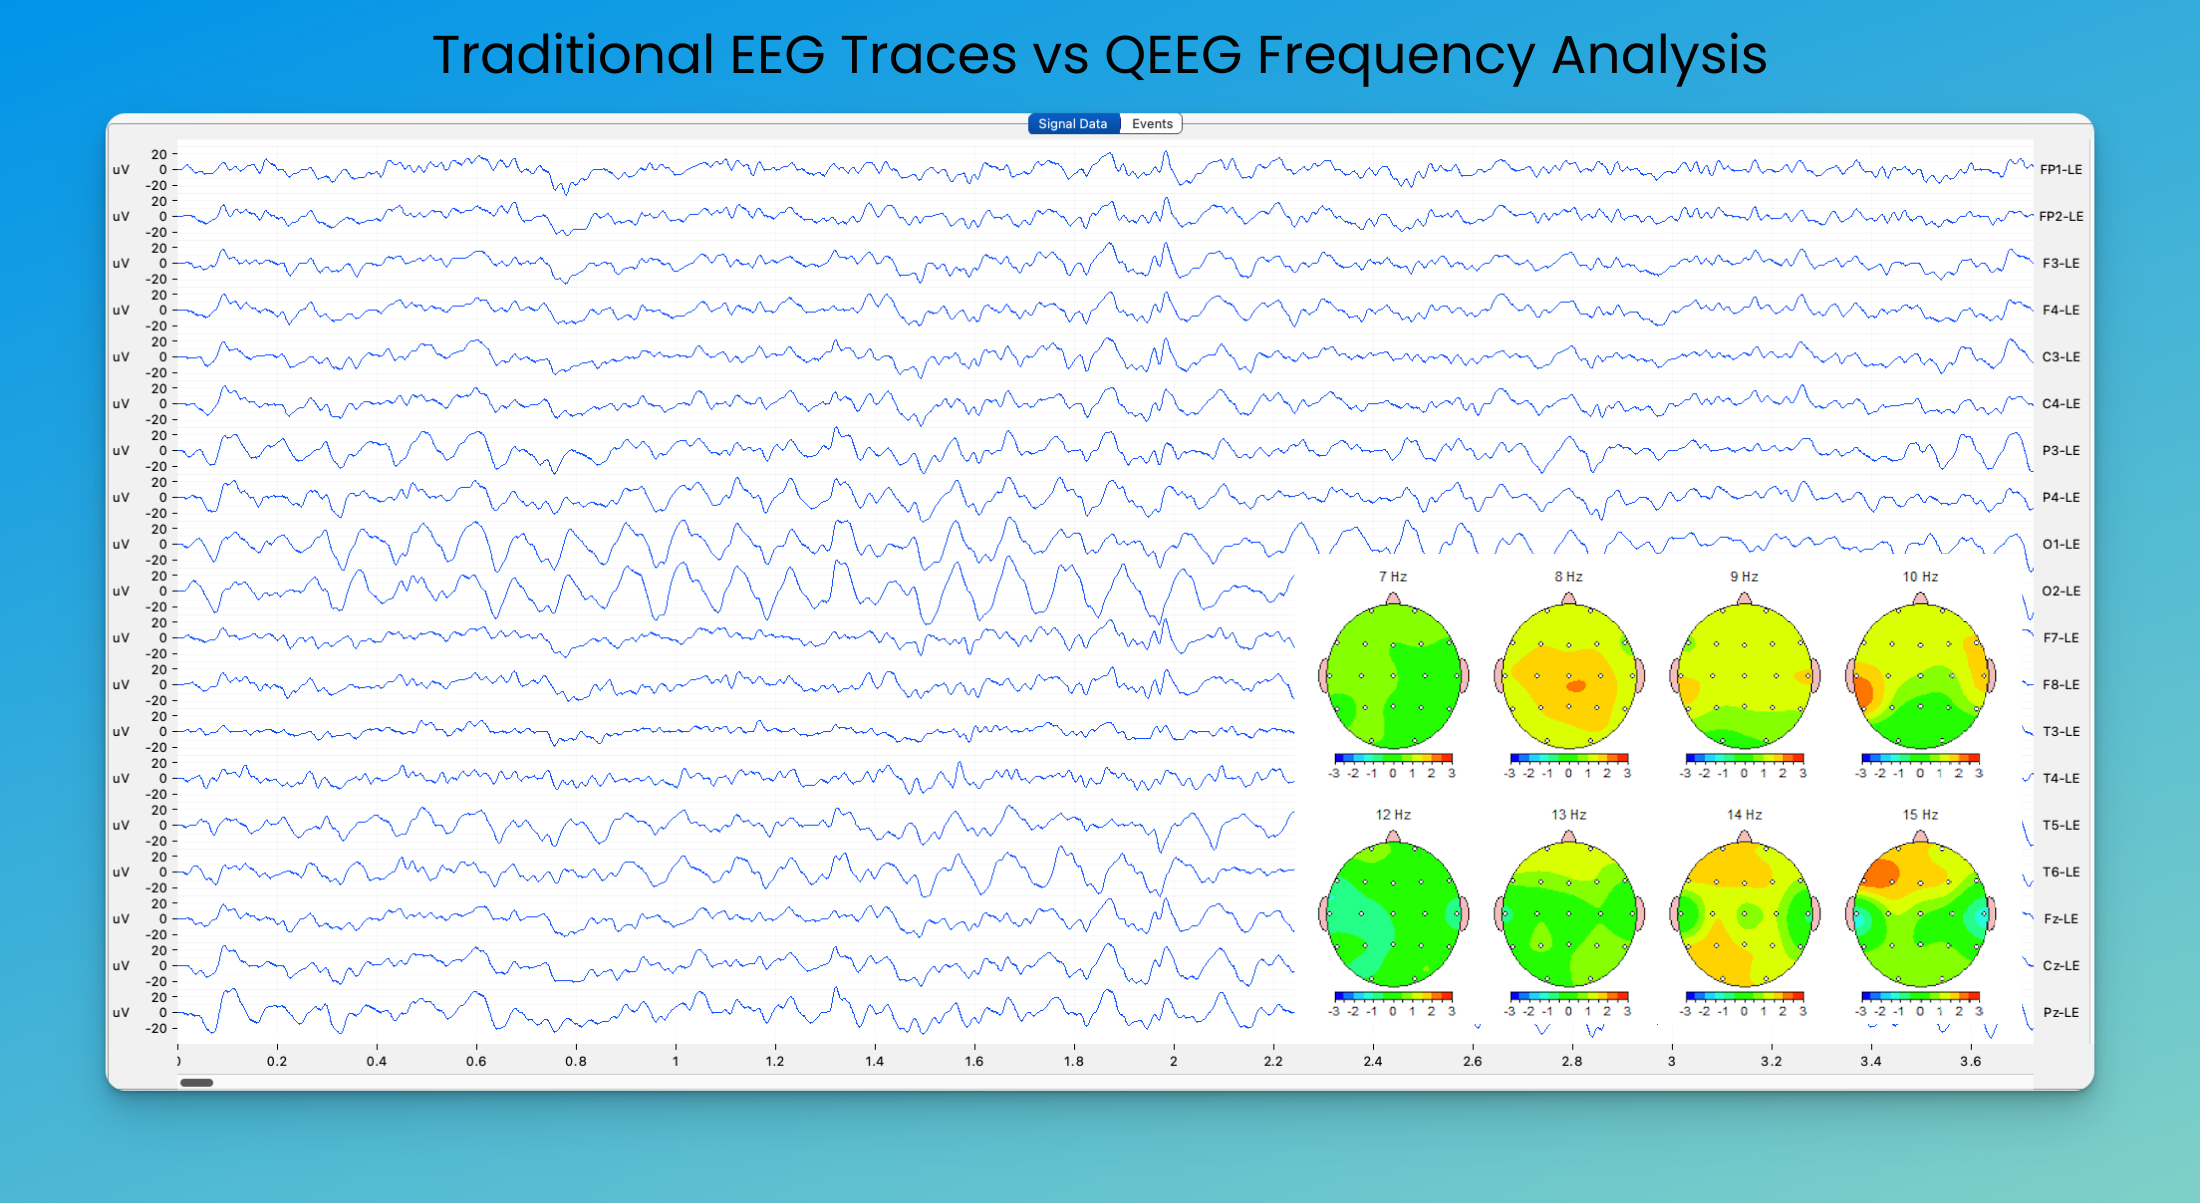
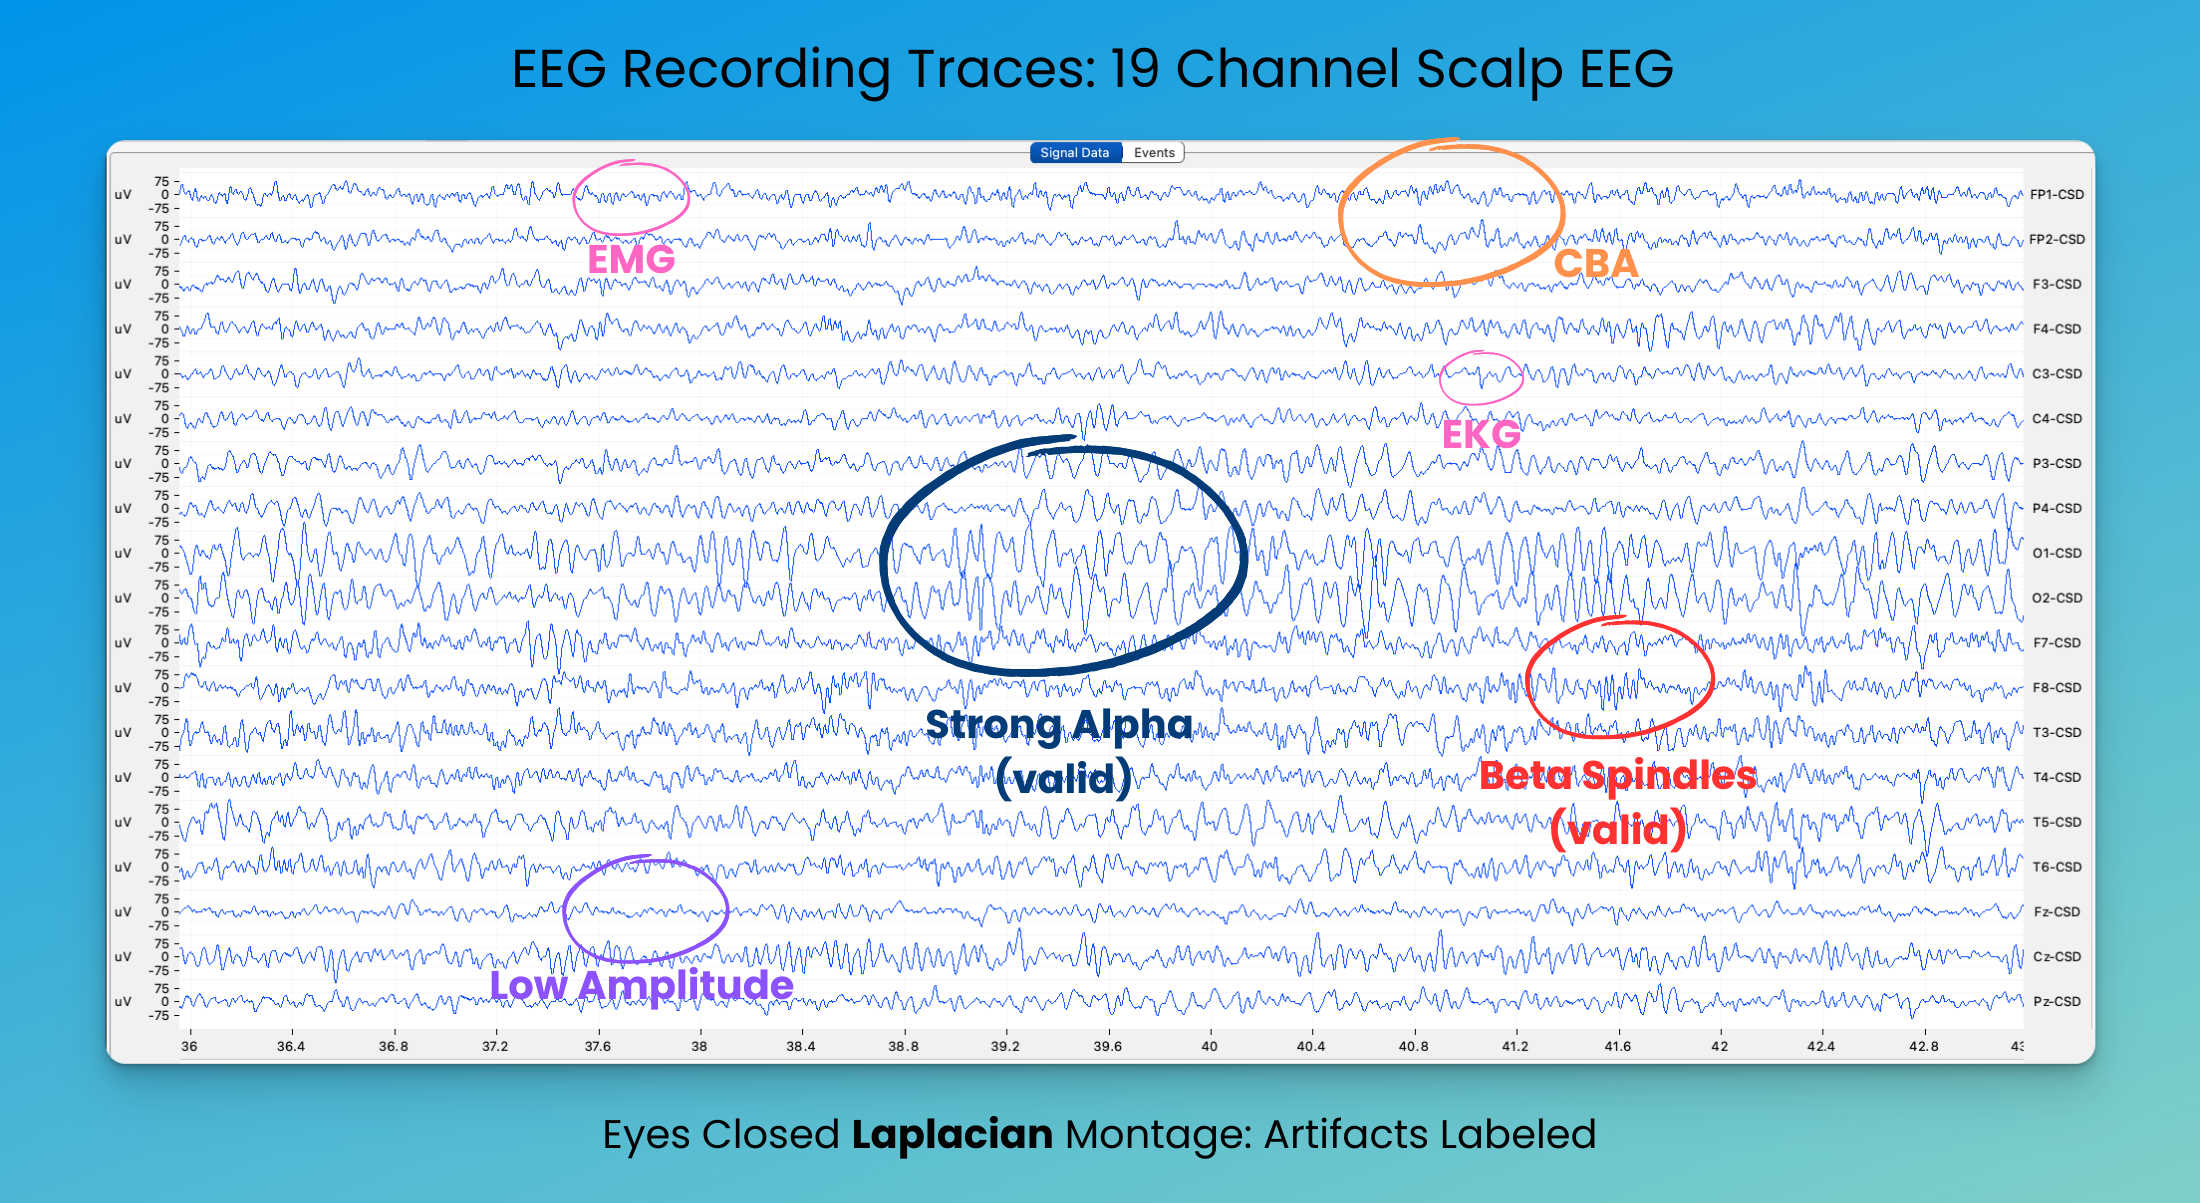
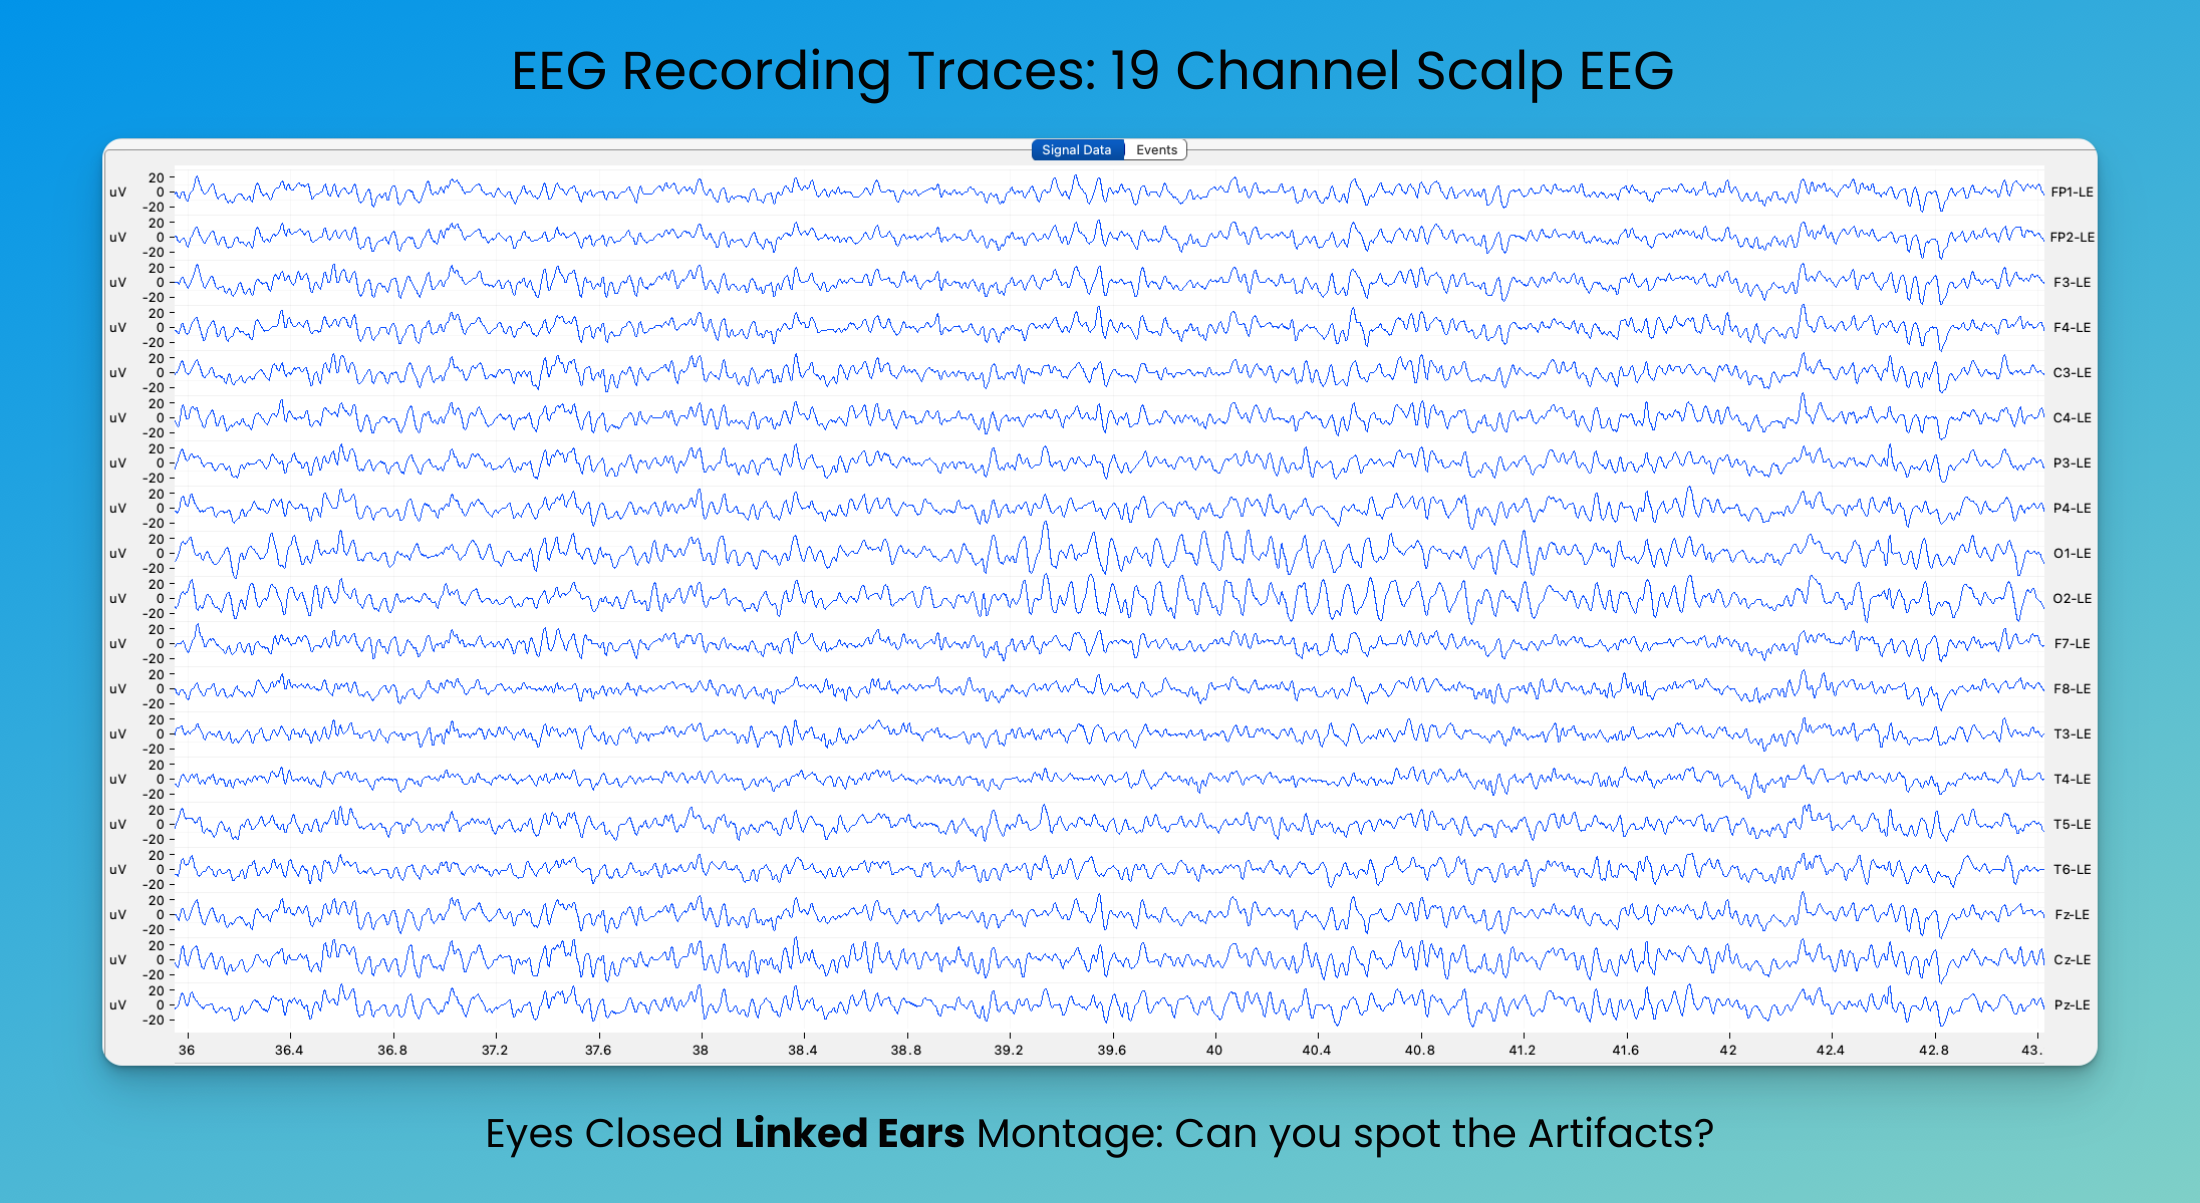
Learning to identify these in raw EEG helps ensure that only clean, artifact-free data is used in the QEEG analysis. Looking at 2 montages can really help you think about what EEG sources are producing patterns across different visualization of raw trace recordings.
Example of Laplacian
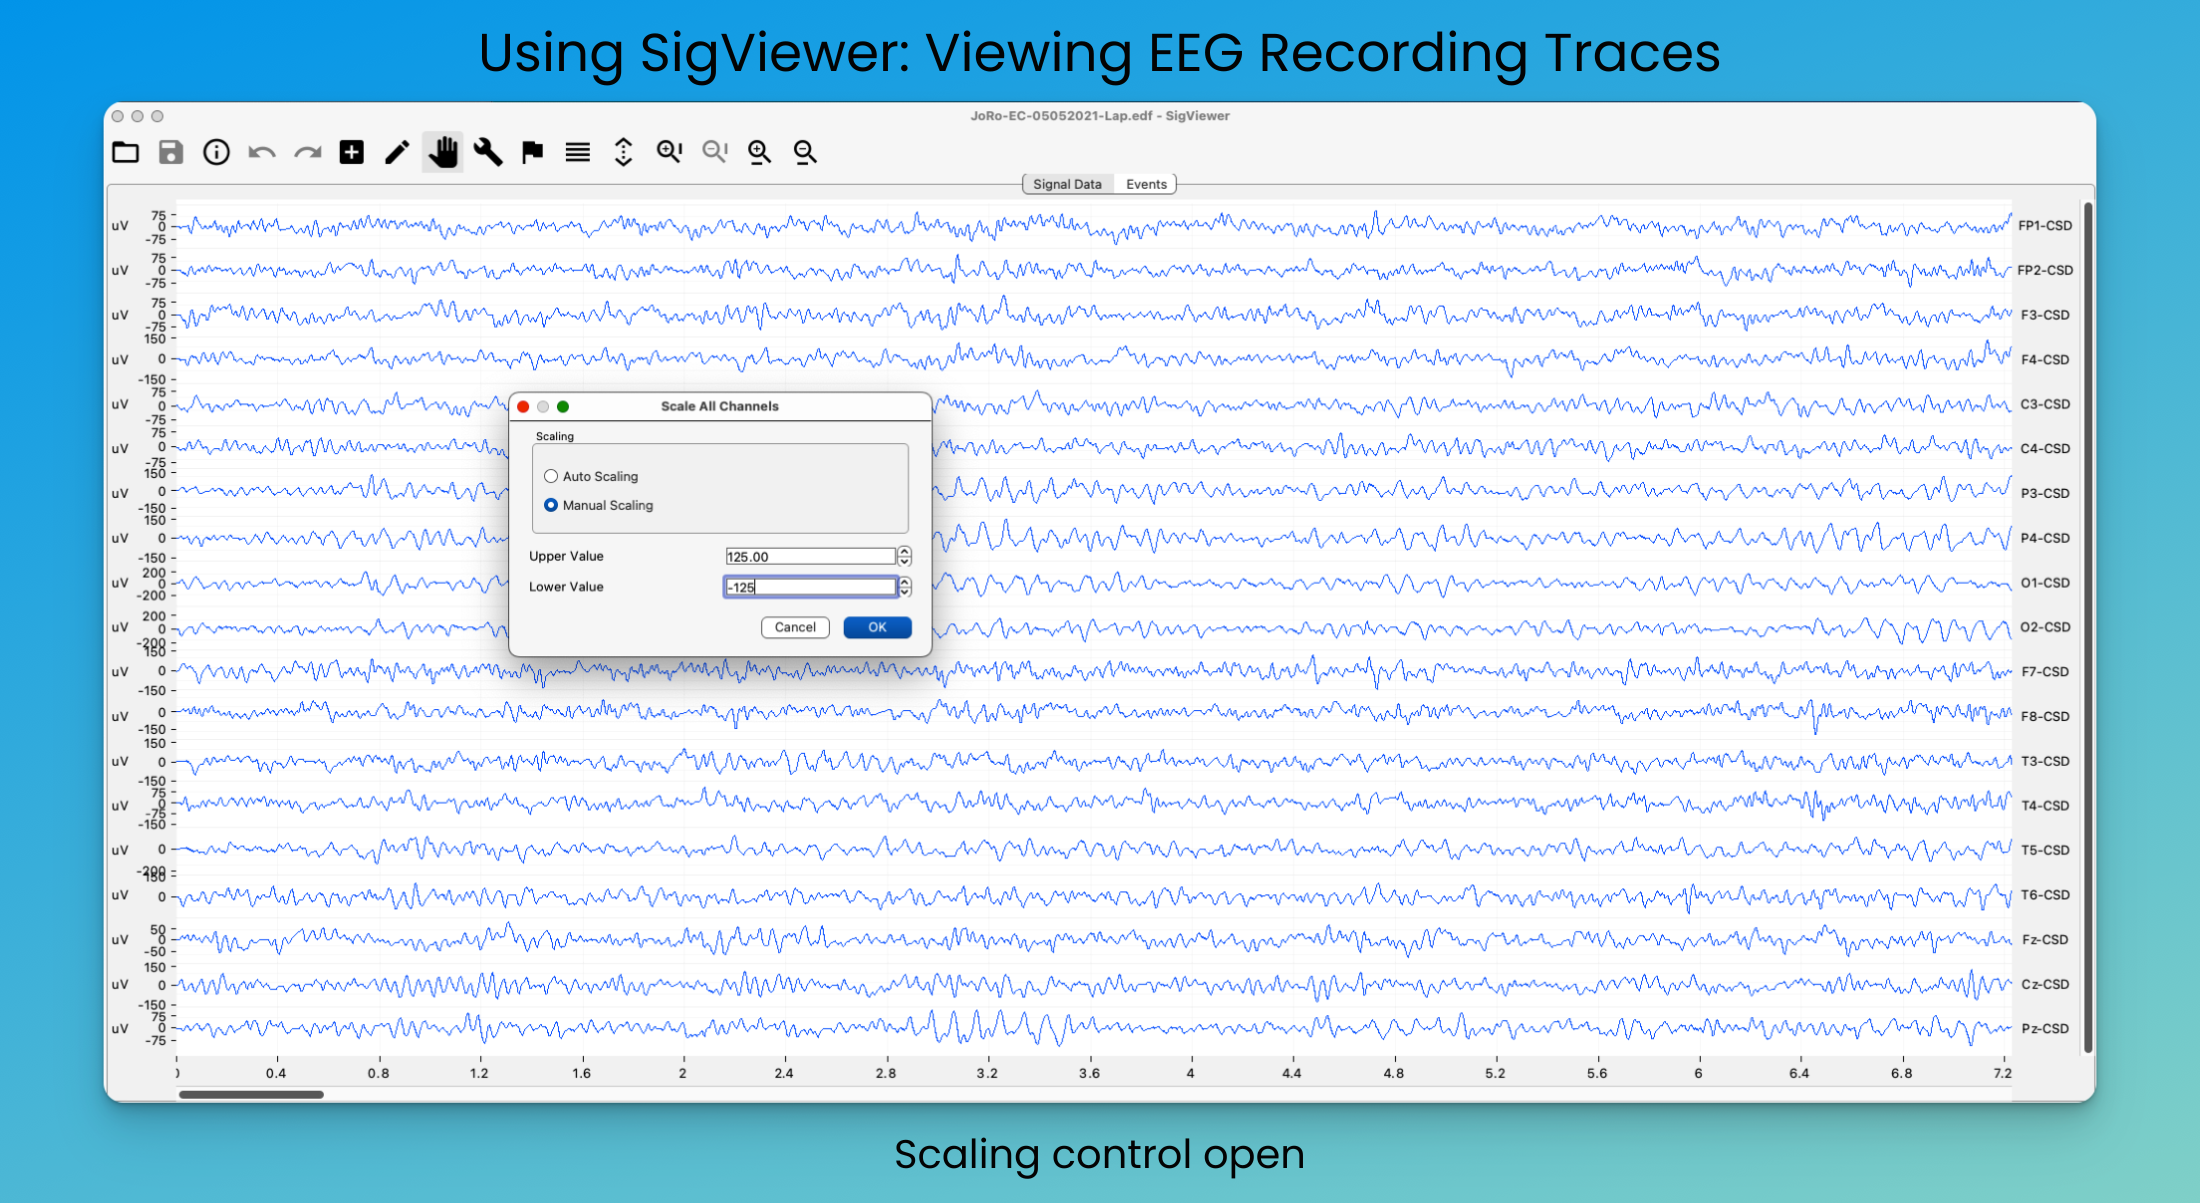
Tools for Viewing EEG Files: SigViewer, EDFBrowser, MATLAB (EEGLAB)
Several tools are available for viewing and analyzing EEG data:
- Sigviewer: A free, open-source tool for basic EEG viewing.
- EDFBrowser: Another free option with additional analysis features.
- EEGLAB compiled version: Does not need a MATLAB license, and lets you get deep in EEG analysis
- MATLAB with EEGLAB: For more advanced users, this combination offers powerful analysis capabilities.
Please review the video for more, but here is an example of SigViewer with an EDF file open:
In the next part of this series, we’ll explore how to use LORETA source analysis for more in-depth EEG visualization.
Keep reading to learn to zero in on what you might want to use those tools to look at.
4. Understanding QEEG Brain Maps
QEEG brain maps are visual representations of the quantitative analysis of EEG data. They typically show:
- Topographic maps: These display the distribution of different frequency bands across the scalp.
- Connectivity maps: These show how different brain regions communicate with each other.
- Asymmetry maps: These highlight differences between corresponding areas of the left and right hemispheres.
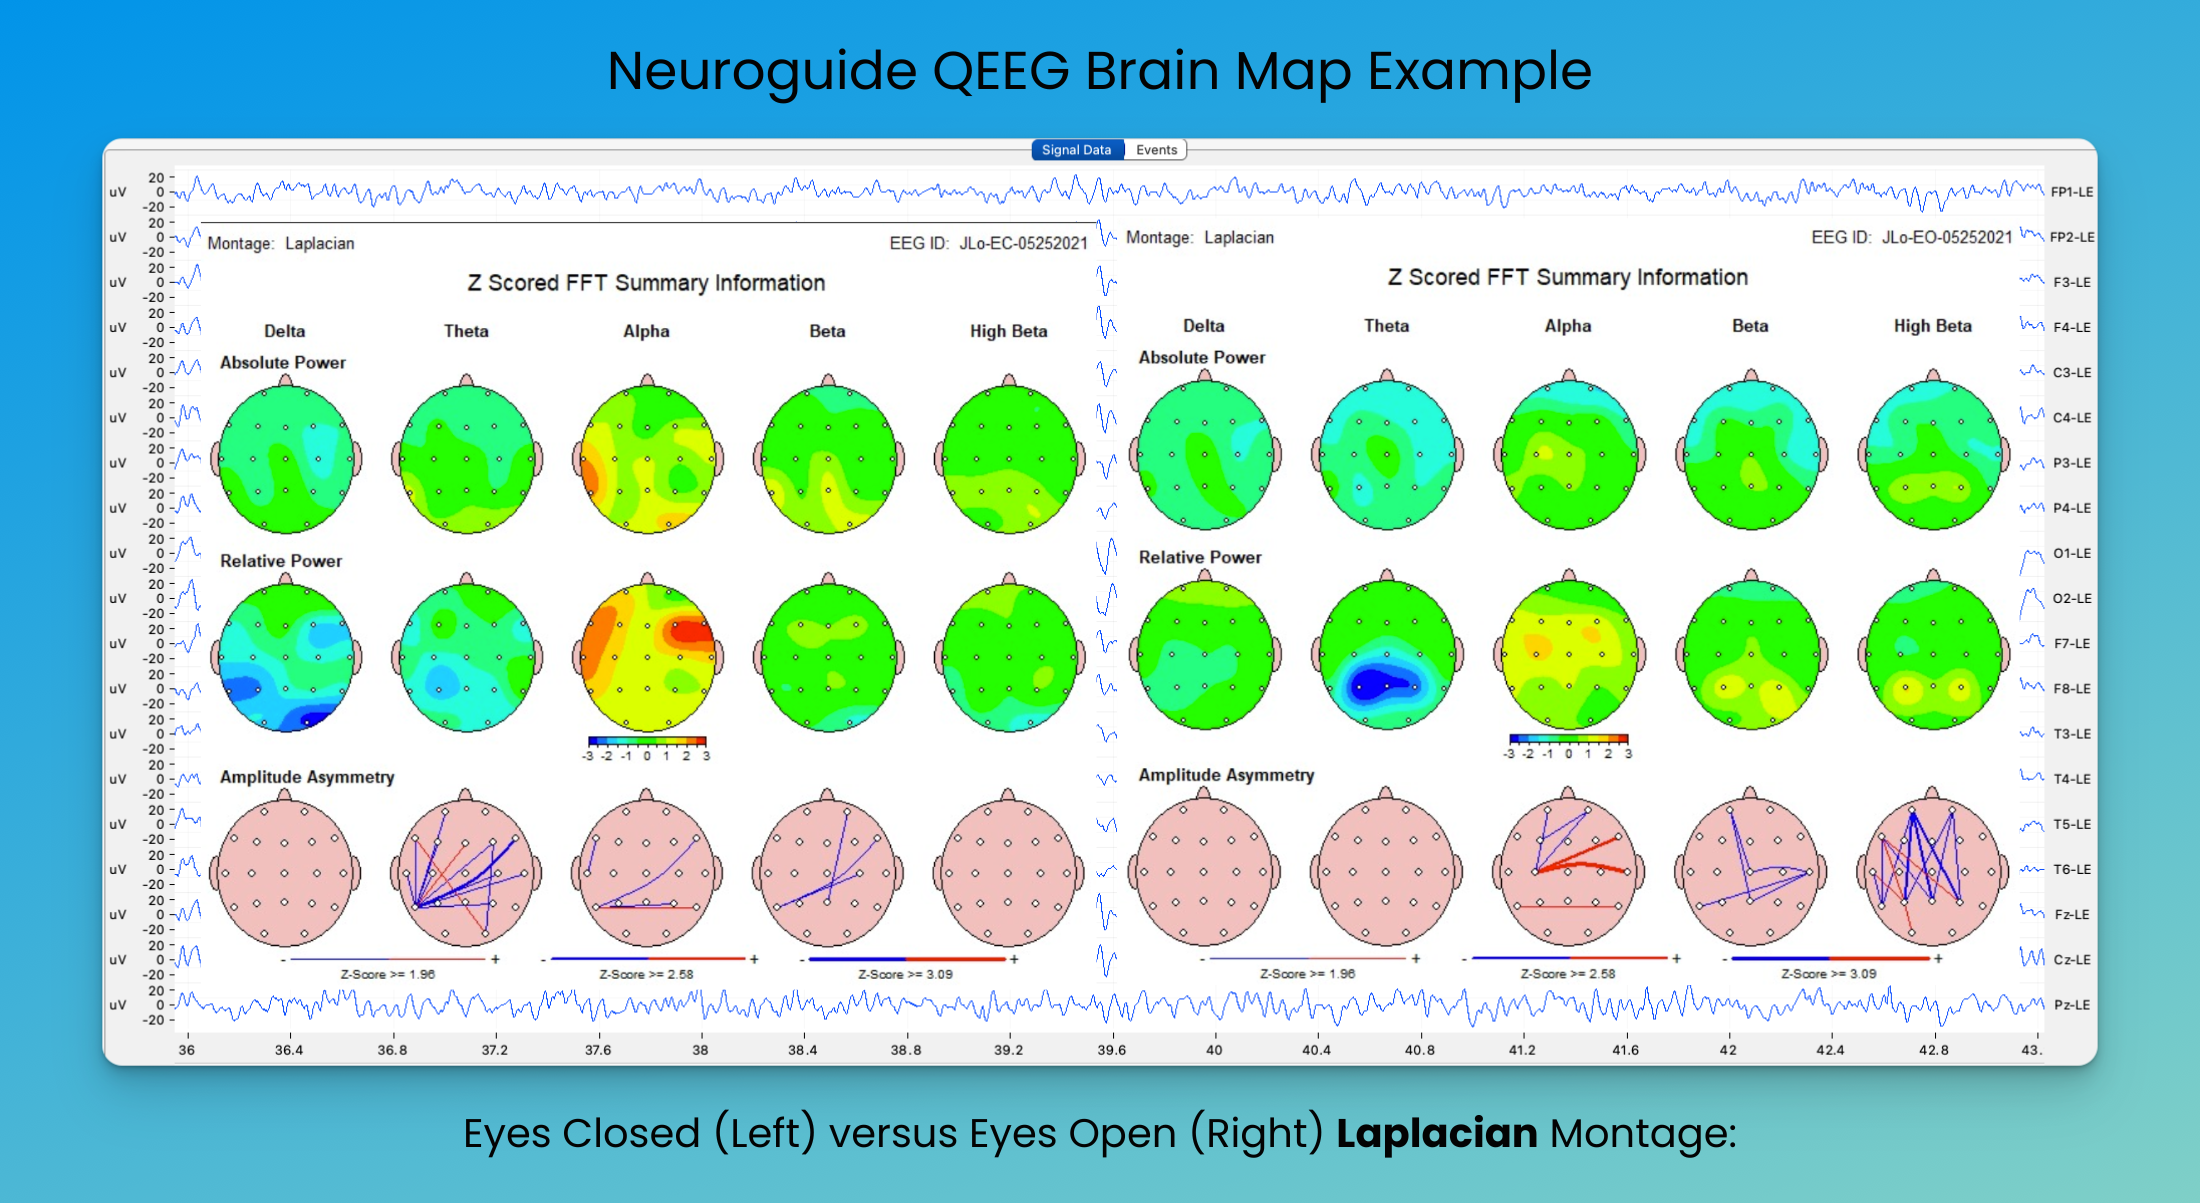
We will look at some maps from the Neuroguide database and EEG analysis toolset below. Neuroguide is one of the industry standard databases, but unfortunately all the QEEG database tools are commercial products.
Neuroguide Normative Database Example (Peak Brain Standard QEEG)
Peak Brain Institute generates QEEGs from 10-20 min of EEG recording (half eyes closed, half eyes open) and always includes a CPT-style attention test. We include that for anyone 7 years old, or older. Hint: The CPT is a pretty boring 20 min even for adults. If your kid is going to do one, tell them it is a “boredom game” to measure how well they can stick it out while being bored.
Files: EDF and PDF files from your QEEG
We often generate hundreds of pages of analyses for the QEEG. To make it easier to digest, we pull out a summary page for each of 4 conditions, including eyes closed and open, and with two different montage displayed.
We prepare those into a PDF for you, and share that along with your IVA2 (CPT). The recording files used for your EEG are also (available in EDF format, or tab delimited format), on request. We have a standard set of 136 pages of analyses and often do secondary analysis involving connectivity and phase coupling between frequencies, but it gets pretty dense, pretty quickly.
But it’s your data – if you want any of that after reading this guide, just give us a shout.
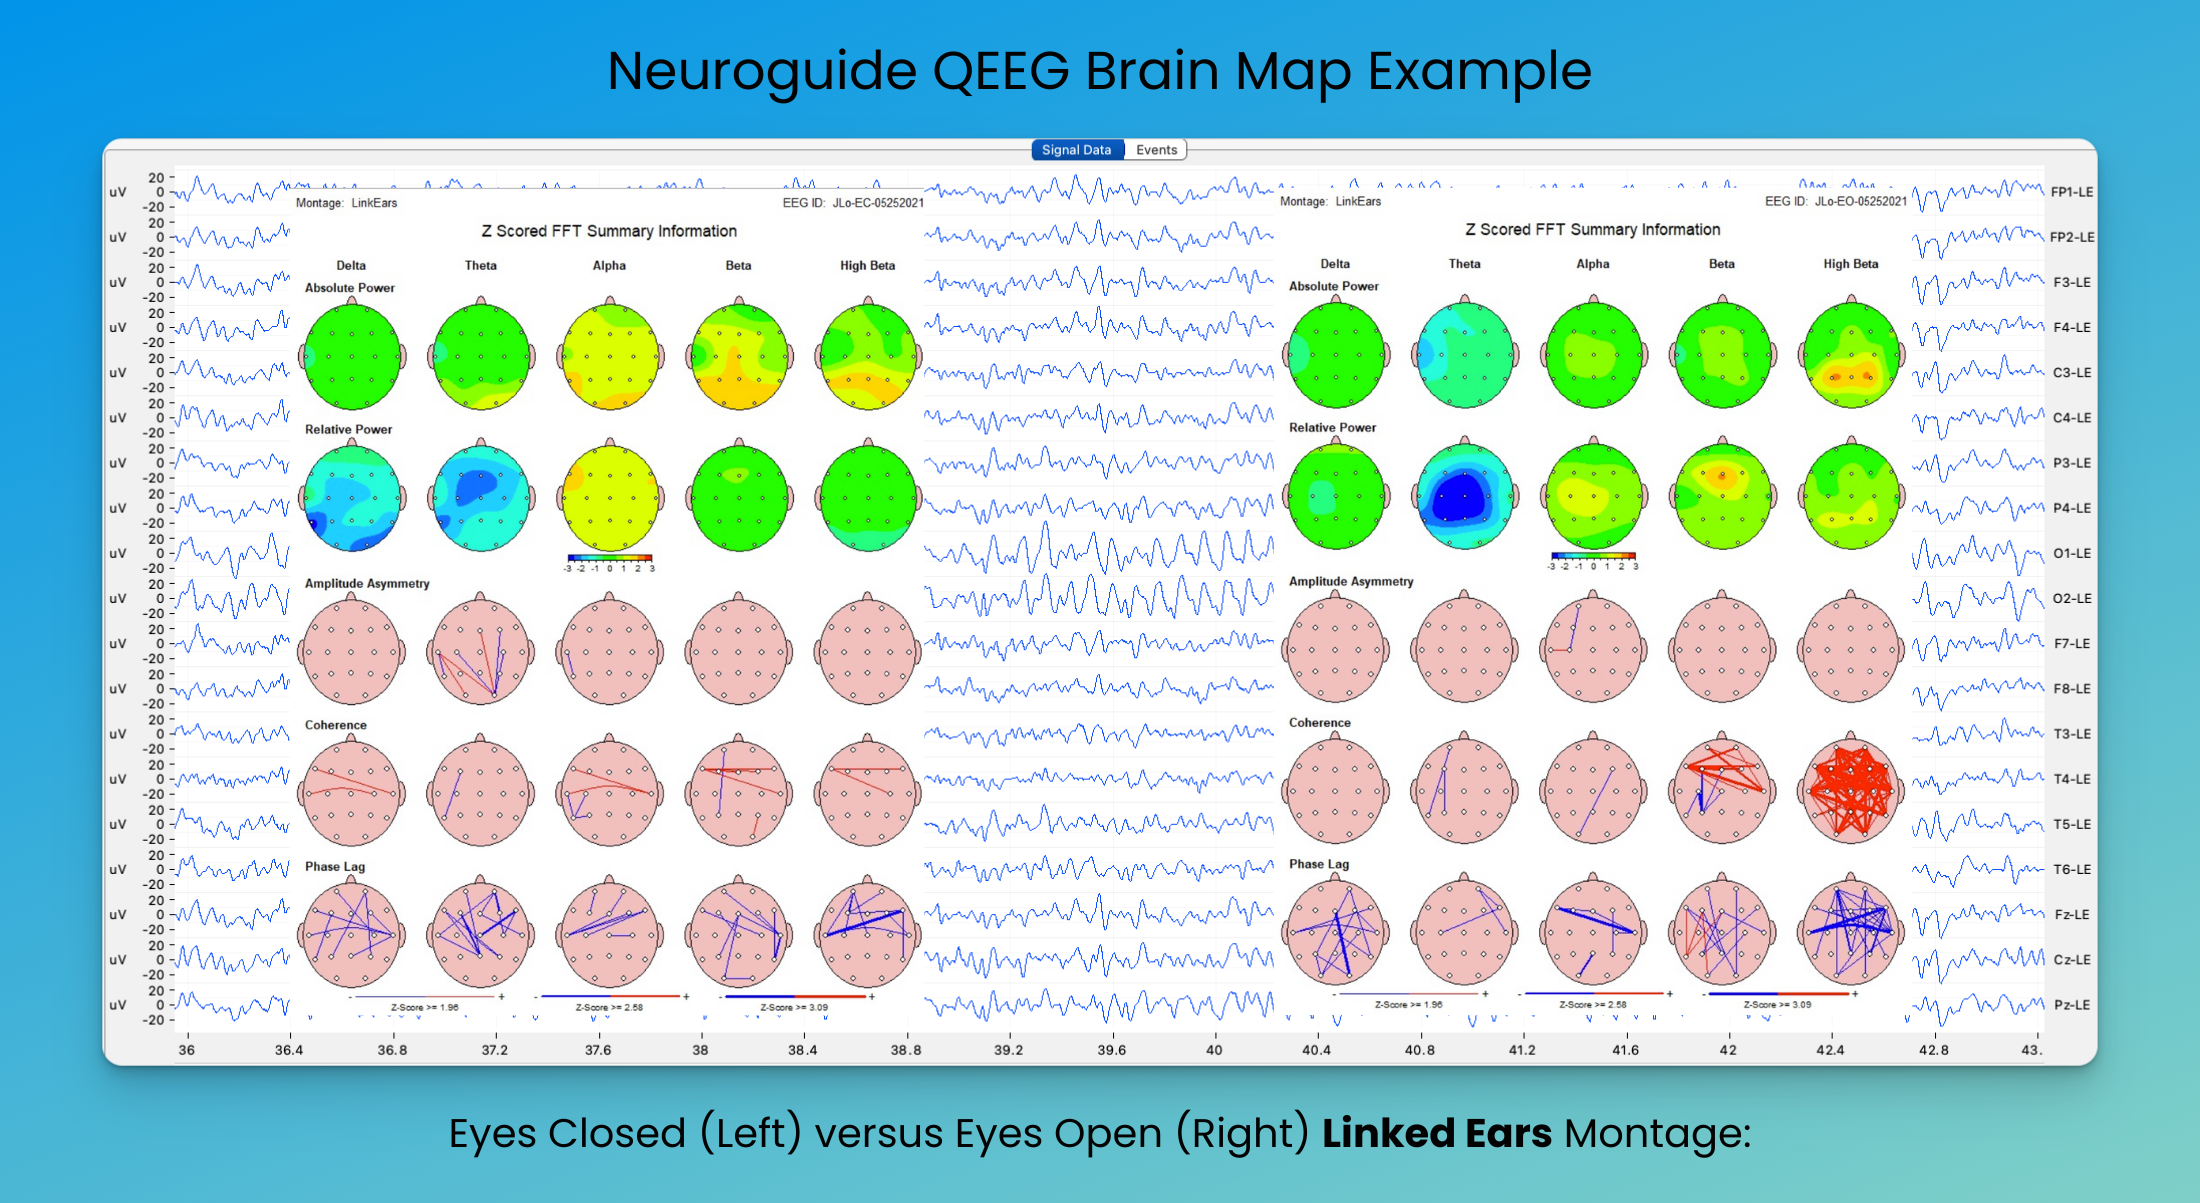
What is a Montage? When looking at PDFs you can see the Montage labeled in the upper left corner. The is the comparison electrode(s) used to make a measurement. We prepare both Laplacian which creates a tighter spatial emphasis but loses regional info, as well as Linked Ears (abbr. LinkEars or LE), which does lose that spatially precise info (i.e. patterns are less tied to the underlying generators) but gains a lot of broad regional information. Since we are looking at everything at once we can also show Coherence (shared EEG information within a frequency band, between regions) as well as as Phase Lag – the timing component of that connectivity.
Look at both Laplacian and Linked in the maps as well as the raw data, to understand how the brain is operating.
Scaling? What do the Colors Mean?
Just like the Power (amplitude) measures in the top rows, the Coherence and Phase are compared to age-matched population samples, and your results are color coded on a bell-curve of how unusual they are. For amplitudes that is the “color bar” in the middle of the pages. Outside of -1 and 1+ things get unusual enough to be worth considering.
For Coherence and Phase, line thickness show between-pair connectivity, at about 2, 2.5, and 3 standard deviations. You can see the scale for those under connectivity plots.
QEEG Examples
Please review the video to see examples of data. Look at the upper left corner for Montage and upper right for EC or EO conditions. Here are a few examples with:
Eyes Closed vs Eyes Open Laplacian Montage:
Eyes Closed vs Eyes Open Linked Ears Montage :
Peak Frequency of EEG brands (EC):
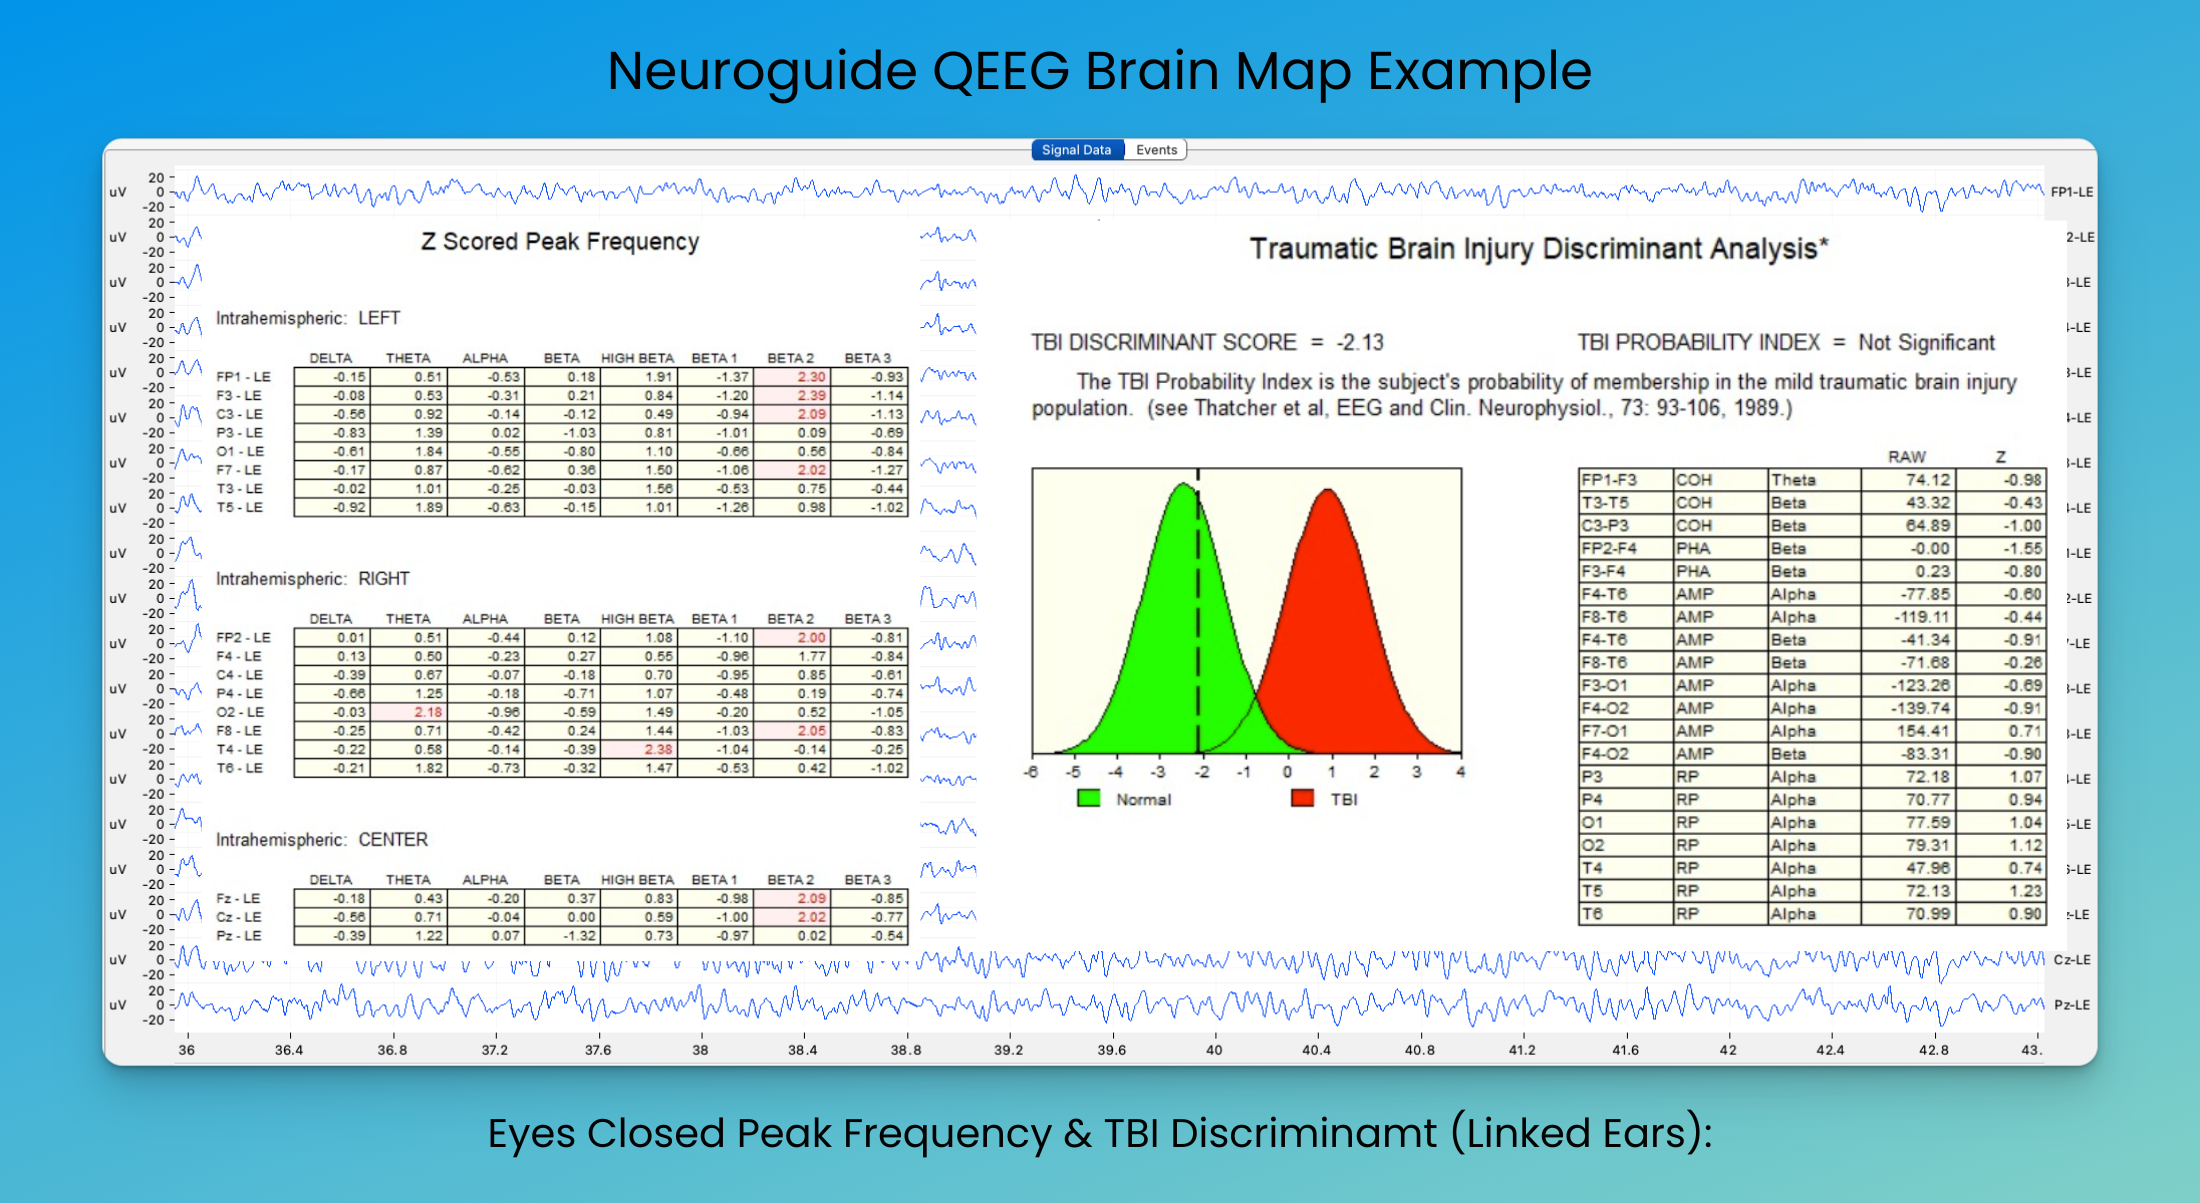
Discriminant Function analysis against TBI (Brain Fog signature) and
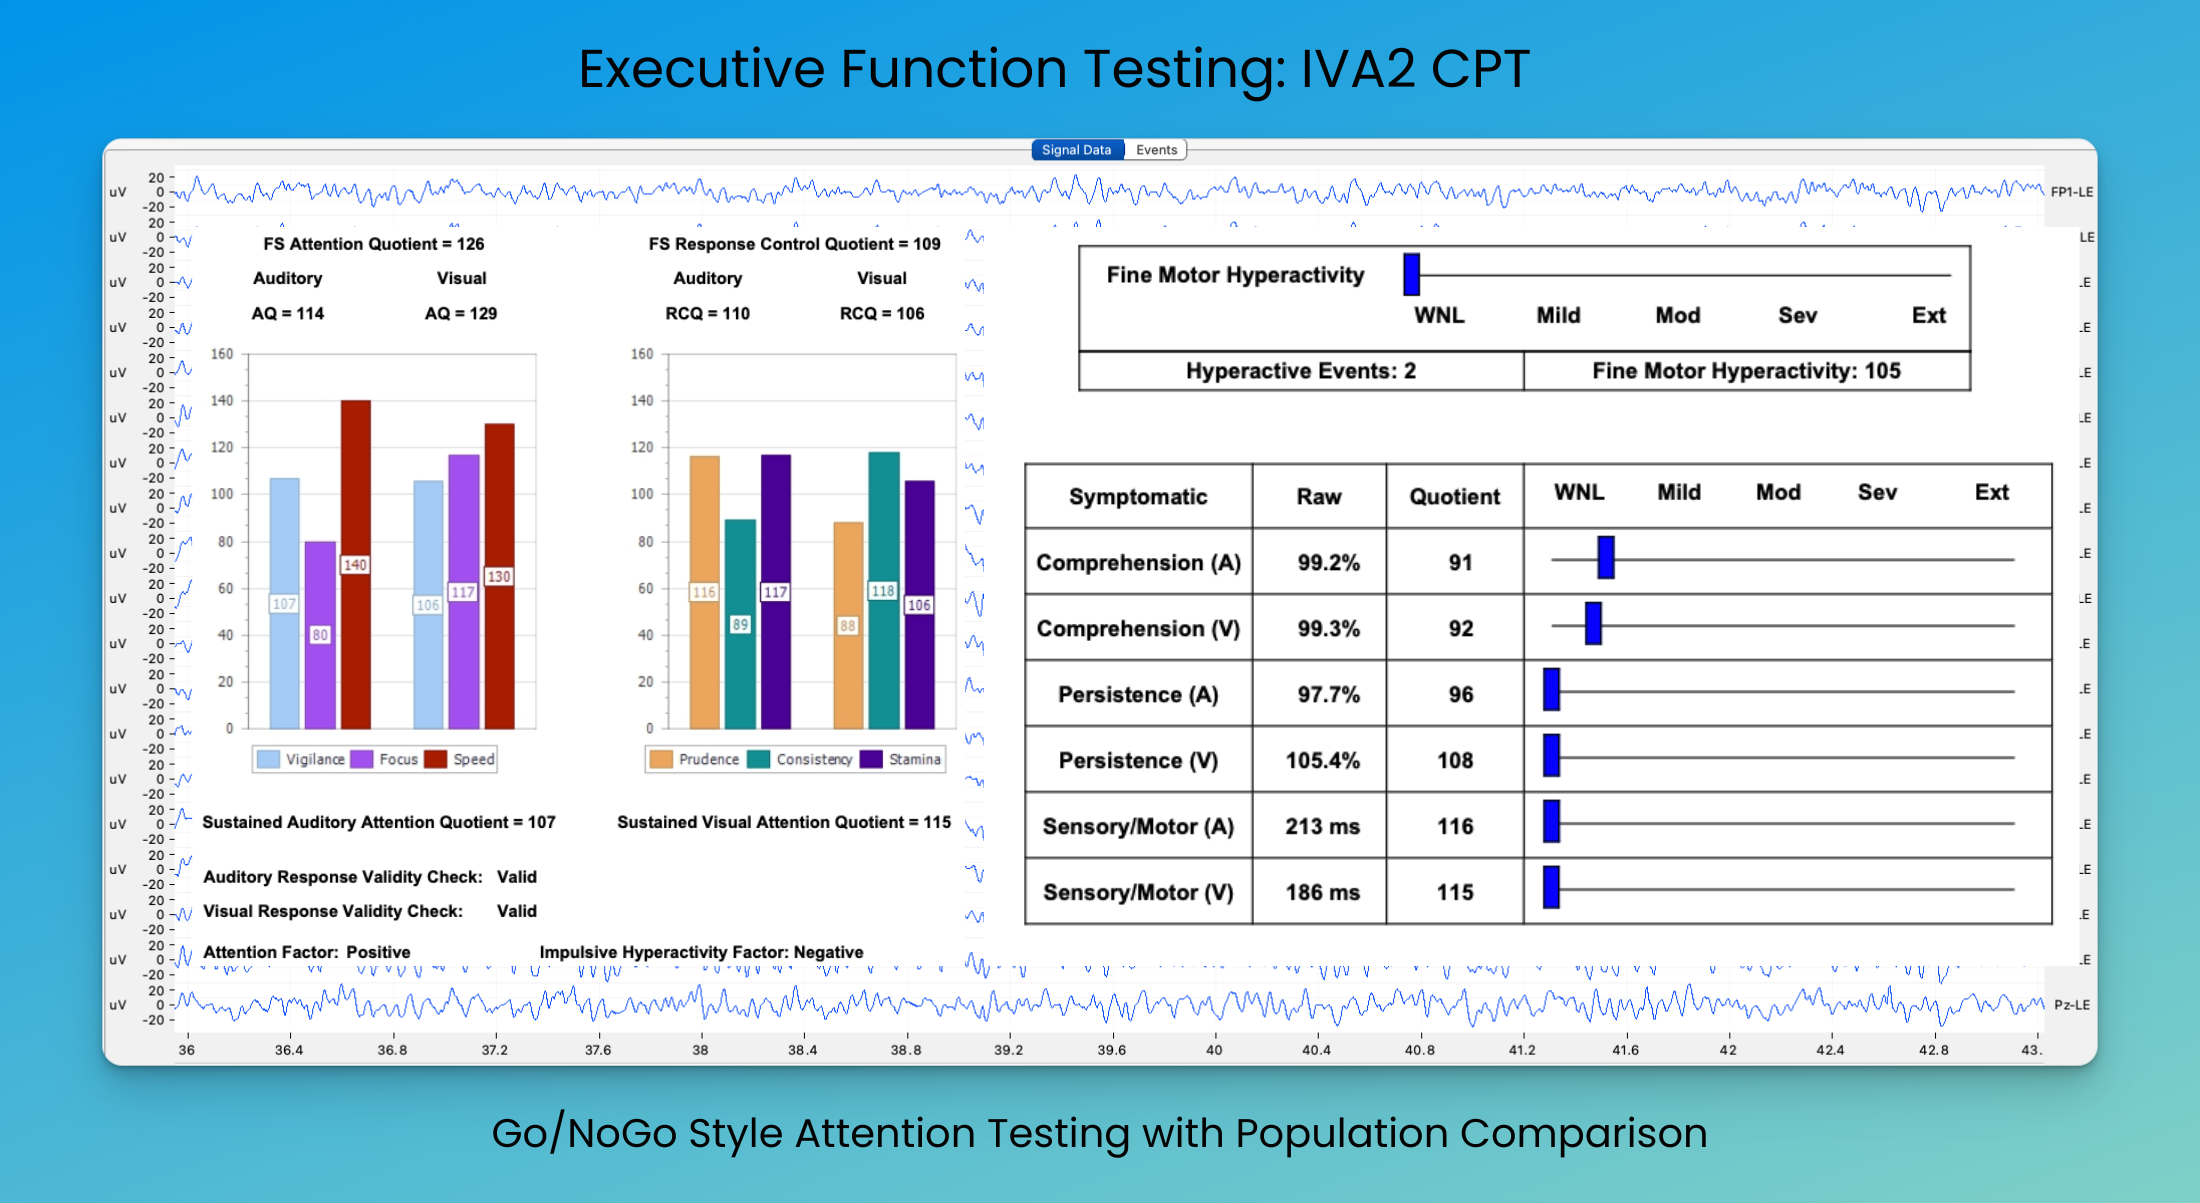
Example of IVA2 Continuous Performance Task (Go / NoGo test of Attention):
QEEG Brain Map Overview
When interpreting these maps, keep in mind:
- Colors typically represent z-scores, with warmer colors (reds) indicating higher-than-average activity and cooler colors (blues) indicating lower-than-average activity.
- It’s essential to look at multiple types of maps (absolute power, relative power, coherence, etc.) to get a comprehensive picture.
- Always consider both eyes-closed and eyes-open conditions, as they can reveal different aspects of brain function.
- Always look at at least 2 montages
- Look at raw EEG traces to judge features from artifact
Electrophysiological Features, Biomarkers, & Phenotypes
When analyzing QEEG data, we often look for specific patterns or features that may be meaningful:
- Features: These are observed characteristics in the EEG data, such as increased frontal theta activity.
- Biomarkers: These are features that have been associated with specific cognitive states or conditions across multiple individuals. However, they may not have the same meaning for everyone.
- Phenotypes: These are features with a known cause and meaning, often linked to genetic variants, medication responses, or typical features of aging.
Understanding which features are classic and conserved across people, which are more unique to you, and which are noise in your data is a crucial skill for accurate interpretation of QEEG data.
QEEG Brain Maps: Hypotheses Generation
When interpreting QEEG data for an individual, it’s important to approach it as a process of hypothesis generation rather than definitive diagnosis. Here’s why:
- Individual Variability: What’s “normal” for one person may not be for another. Be weird – good job.
- Context Matters: QEEG patterns should be interpreted considering the individual’s symptoms, performance, and goals.
- Exploratory Tool: QEEG is best used to guide investigation and personalize interventions, not as a diagnostic tool.
By combining QEEG data with other assessments (like Continuous Performance Task assessment) and the individual’s reported experiences, we can generate meaningful hypotheses about brain function and potential interventions.
If we do this properly, then the hypotheses we generate from QEEG are pretty much things you already know. Seeing each region of the brain showing its regulation and patterns crystallized in measurement can be eye opening, and can help you take control of making changes. Seeing things like ADHD, or your fatigue, anxiety features that drive obsession or fear, speed of processing that drags down your word finding and short term memory – it is all empowering. You know how you feel. Once you know how it works it is easier to shift it, and understanding your brain can really make it less overwhelming.
Further Action
Once you’ve analyzed your QEEG and performance testing and started to develop some perspective on your own EEG features, you can employ several strategies and tailor different interventions to your specific goals. Here are some approaches that can potentially lead to rapid and visible changes in EEG patterns and cognitive performance:
- Medication: Certain medications, particularly those targeting neurotransmitter systems, can have significant effects on brain activity. Always consult with a qualified healthcare professional before considering medication changes.
- Meditation: Regular meditation practice has been shown to alter brain wave patterns, particularly in the alpha and theta bands. Different types of meditation may have varying effects on EEG patterns.
- Neurofeedback: This type of neurotherapy involves biofeedback on brain activity, allowing changes in regulation of brain resources. Neurofeedback can be tailored based on QEEG findings to target specific patterns, with changes showing up as you do 20-25 neurofeedback sessions. Peak Brain can help you here, with in office or at home training.
- Sleep & Circadian Rhythm Optimization: Improving sleep quality and aligning your activities with your natural circadian rhythm can have profound effects on brain function. This might involve adjusting sleep schedules, managing light exposure, or addressing sleep disorders.
- Cognitive Training & Game: Targeted cognitive exercises can help strengthen specific cognitive functions and potentially alter associated brain activity patterns. This might include learning chess, or practicing skills you want to master.
- Nutrition and Supplementation: Certain nutrients and supplements may support brain health and function. Examples include omega-3 fatty acids, B-vitamins, and specific nootropics.
- Physical Exercise: Regular physical activity, especially resistance training, has been shown to have positive effects on brain function and can alter EEG patterns over time.
- Stress Management Techniques: Practices such as deep breathing exercises, progressive muscle relaxation, or HRV biofeedback can help manage stress, which often has a significant impact on brain activity.
- Environmental Modifications: Adjusting your work or living environment to reduce sensory overload, improve ergonomics, or enhance cognitive function can support brain health.
- Cognitive Behavioral Therapy (CBT): For individuals with specific cognitive or emotional challenges, CBT can be an effective way to alter thought patterns and behaviors, potentially reflected in changes in brain activity.
Remember, the most effective approach often involves a combination of these strategies, tailored to your individual QEEG results, cognitive profile, and personal goals. It’s always recommended to work with a qualified professional when implementing significant changes to your cognitive enhancement regimen. If you need support with brain coaching that includes neurofeedback, please consider reaching out to us at Peak Brain. We would be happy to support your goals for improving performance and reducing suffering.
Key Moments Summary & Conclusion
I hope you got something out of this article, or watched the video and it got you thinking about QEEB brain mapping. QEEG is a powerful tool for understanding brain function, but it requires careful interpretation and a nuanced understanding of both the technology and the complexities of human cognition.
Give me a shout if I can help you understand your brain. In the next part of this series, we’ll explore more advanced techniques for EEG analysis using LORETA source analysis, which can provide more detailed insights into brain function.
Remember, the goal of QEEG is not to label brains as “good” or “bad,” but to understand each individual’s unique patterns of brain activity and use that information to guide personalized strategies for cognitive optimization or clinical intervention.
Once you understand more about how your brain works, you can start making changes.
Check out Part 2 to get deeper!
Or schedule your QEEG with Peak Brain if you need fresh data!
QEEG Source Localization with LORETA: Using Electromagnetic Tomography to explore Quantitative EEG via Source Estimation
Ready to Get Started?
Schedule a consultation to learn how neurofeedback can help you achieve your goals.